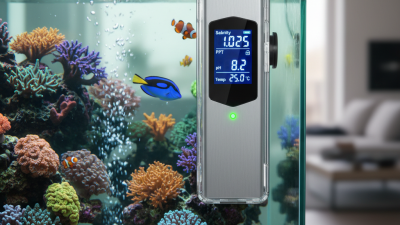
2026 Best Ammonia Nitrogen Sensor for Water Quality
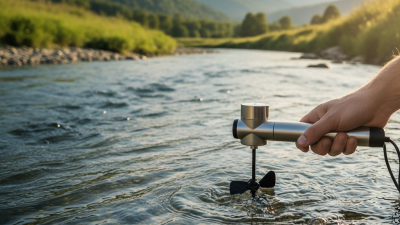
Choosing the 2026 best Ammonia Nitrogen Sensor for water quality starts with the conditions it must measure. In aquaculture tanks, treatment systems, and environmental monitoring sites, ammonia readings can inform routine operational decisions. A useful sensor should provide results suited to the required range, respond consistently, and fit the site’s monitoring workflow. Small changes matter. But readings need context.
Sensor performance can vary with temperature, pH, water composition, installation, and maintenance. Some instruments measure ammonia directly, while others use methods that require additional interpretation. No sensor is perfect. A specification sheet cannot show every challenge in a real tank or sampling line. That is why calibration requirements, response time, cleaning needs, data outputs, and technical support deserve careful review. Check whether the stated measurement range and accuracy match your application, and confirm how often the manufacturer recommends calibration. Independent test data or documented field experience can help, but results should be compared under similar conditions.
The best choice is not automatically the most expensive or feature-rich model. It is the one that produces dependable, understandable data in your water and operating environment. Consider the total cost of ownership, including probes, consumables, service, and staff time. A neat ranking can be useful, but water rarely behaves neatly. Use comparisons as a starting point, then verify performance against your own monitoring needs. That practical check may reveal limitations a product page does not make obvious.
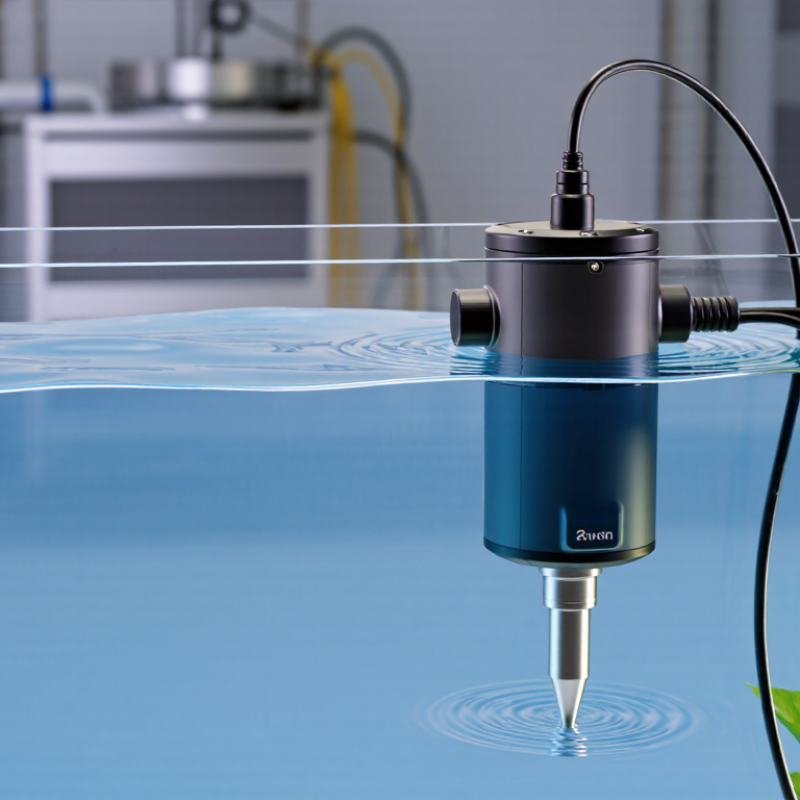
Define the measurand: NH₃-N is reported on nitrogen’s 14.007 g/mol basis
A dependable ammonia nitrogen sensor starts with a clear measurand. NH₃-N means the concentration is reported as the mass of nitrogen, not the full ammonia molecule. Its basis is nitrogen’s molar mass: 14.007 g/mol. This distinction matters when comparing readings, setting alarms, or reviewing a treatment record.
Check the instrument’s displayed unit. A reading of 1 mg/L as NH₃ is not the same as 1 mg/L as NH₃-N. For mass-based results, convert NH₃ to NH₃-N by multiplying by 14.007/17.031. The reverse conversion uses 17.031/14.007. Keep the reporting basis beside every value. Easy to overlook. A spreadsheet can preserve a number while quietly losing what that number represents.
Field conditions add another layer. pH and temperature affect the balance between dissolved ammonia and ammonium, so a sensor’s method and measurement conditions matter. Record them with calibration checks and sample results. I would not compare two sensors until I had confirmed both report the same measurand and units. That takes a little extra care. It is not glamorous, and I have seen unit labels get less attention than the sensor itself. A reference method can help verify performance, especially when readings sit near an operational limit.
Account for speciation: ammonium pKa is about 9.25 at 25°C
A 2026 ammonia nitrogen sensor should be judged by what it measures, not just its displayed number. In water, total ammonia nitrogen includes ammonium ions (NH4+) and un-ionized ammonia (NH3). Their balance shifts with pH. At 25°C, ammonium’s pKa is about 9.25; near that pH, the two forms occur in roughly equal amounts. Below it, ammonium predominates. Above it, the NH3 share rises quickly.
This changes how readings should be interpreted. At pH 8.25 and 25°C, roughly 9% of the dissolved ammonia is NH3; most remains NH4+. A sensor responding mainly to ammonium may not directly report total ammonia nitrogen. Check the measurement method, and record pH and temperature beside each result. Temperature matters because the equilibrium shifts as water warms or cools. Calibration also deserves attention: salts and other dissolved substances can affect sensor response. Small details matter.
A clean reading can still mislead. A tidy spreadsheet may hide a pH change between sampling and measurement, especially if a sample sits in a warm bottle. That is an imperfect workflow, but a common one. For useful comparisons, measure promptly, follow the instrument’s calibration procedure, and confirm whether results are reported as nitrogen, NH4+, or NH3.
Check aquatic limits: EPA ammonia criteria vary with pH and temperature
2026 Best Ammonia Nitrogen Sensor for Water Quality
EPA ammonia criteria are not a single fixed limit. The agency’s 2013 freshwater criteria report calculates acute and chronic values using pH and temperature. Warmer water and higher pH increase the share of ammonia present as toxic, un-ionized NH3. That matters at a pond outlet on a hot afternoon: the same total ammonia nitrogen reading may represent a different risk than it did in cool, lower-pH water. A sensor that records ammonia without reliable pH and temperature data can leave a misleading picture.
For useful compliance screening, look for stable readings, clear reporting units, and calibration procedures suited to the water matrix. EPA’s criteria are expressed as nitrogen, so confirm whether the instrument reports ammonia as nitrogen or in another unit before comparing results. Record pH and temperature beside each reading, and verify sensor results periodically with a suitable laboratory method. The EPA report provides criteria equations and supporting technical details; it does not make every site’s conditions identical. Field variation is real. I would not treat one sensor reading as a complete ecological assessment.
Tips: Check the sensor after cleaning or calibration, then compare a field sample with a lab result. Keep the probe shaded during hot-weather sampling. Small handling errors matter. Document them anyway.
Verify the 2026 sensor using calibration, drift, and reference-method checks
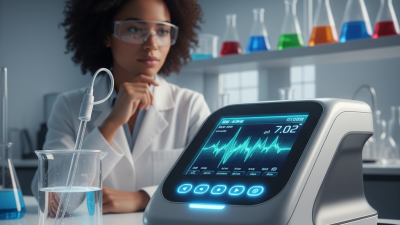
For a 2026 ammonia-nitrogen sensor, verification should begin with the water it will actually monitor. Calibrate using fresh standards that bracket expected concentrations, and record temperature, pH, and stabilization time. Check low and mid-range points. A one-point calibration may look reassuring but miss a slope error. Keep dated records.
Check drift by comparing readings before and after deployment against the same standard. Then collect paired water samples and compare sensor results with a laboratory reference. The U.S. EPA’s Method 350.1 describes ammonia-nitrogen analysis over 0.01–2.0 mg/L as N. This gives a useful reference range, not a guarantee that every sensor performs accurately across it. Compare results on several dates, and investigate consistent bias rather than hiding it with recalibration.
Tips: Rinse the probe between standards, avoid bubbles on the sensing surface, and note any unusually turbid or changing water. Set acceptance limits before testing, based on the application and method uncertainty. A stable number is not proof of accuracy. Calibration records can still miss sampling errors.





 Contact WhatsApp
 Contact Phone
 Contact Email