What is a Water Quality Monitoring Station and How Does it Work?
Water Quality Monitoring Stations play a vital role in assessing the health of our water bodies. These stations are equipped with advanced sensors and instruments that measure various parameters, including temperature, pH, dissolved oxygen, and contaminants. By collecting real-time data, they help scientists and policymakers understand water quality trends over time.
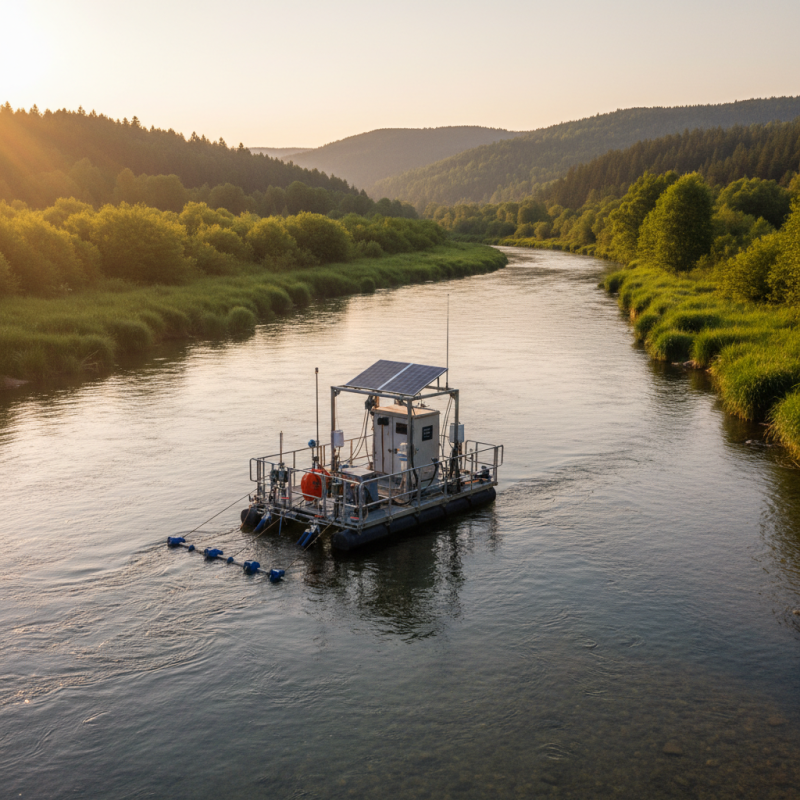
The operation of a Water Quality Monitoring Station is both complex and crucial. These stations are strategically placed in rivers, lakes, and coastal areas where water quality can be affected by numerous factors. Regular monitoring helps in detecting pollution and understanding seasonal variations. However, challenges remain, such as equipment malfunctions and the need for accurate data interpretation.
Despite their importance, there can be limitations to the effectiveness of Water Quality Monitoring Stations. Environmental changes, sampling frequency, and data management can introduce uncertainties. Continuous improvement in monitoring technology is necessary. Investing in training for personnel is equally essential. Moving towards more reliable and comprehensive monitoring systems remains a critical goal for environmental protection efforts.
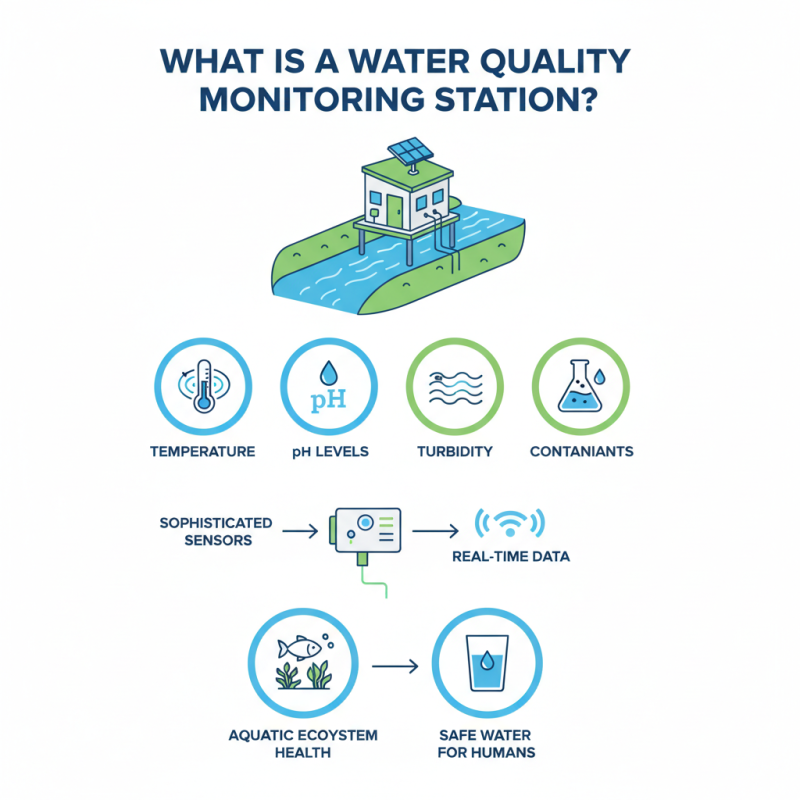
What is a Water Quality Monitoring Station?
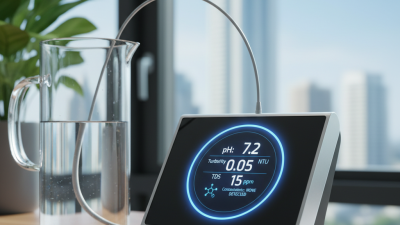
A Water Quality Monitoring Station is a crucial facility designed to assess the quality of water in various bodies. These stations collect data on several parameters, such as temperature, pH levels, turbidity, and the presence of contaminants. They often use sophisticated sensors to provide real-time information. This data helps in understanding the health of aquatic ecosystems and ensures safe water for human consumption.
Each station is strategically placed in rivers, lakes, or coastal areas. This positioning allows for comprehensive monitoring of water quality over time. The information gathered can guide local authorities in making informed decisions. However, despite advanced technology, some limitations exist. Sensors may malfunction, affecting data accuracy. Environmental factors can also influence readings, making consistency a challenge. Continuous improvements in technology and practices are essential for maintaining reliability in water quality assessments.
Components of a Water Quality Monitoring Station
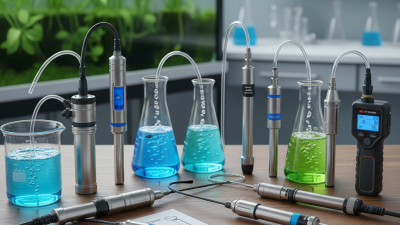
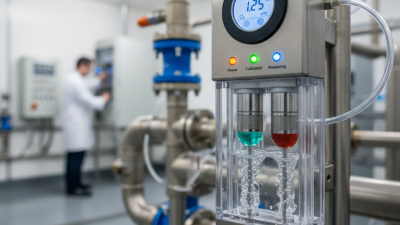
Water quality monitoring stations play a vital role in ensuring the health of our water bodies. These stations are equipped with various components that work together to provide accurate data on water quality. Key components include sensors, data loggers, and communication systems.
Sensors are the heart of monitoring stations. They measure parameters such as pH, turbidity, and dissolved oxygen. According to the U.S. Environmental Protection Agency, approximately 70% of freshwater ecosystems are impacted by pollution. Monitoring these parameters helps identify trends and potential threats to aquatic life.
Data loggers store the information collected by sensors. They ensure that data is recorded at regular intervals, which can be crucial for longitudinal studies.
Communication systems facilitate data transmission to centralized databases. This allows for real-time monitoring and quicker response to water quality issues. As per industry reports, timely data can reduce the response time to pollution incidents by up to 30%. However, not all monitoring stations are equipped with the latest technology, leading to gaps in data quality.
Without consistent upgrades, the reliability of reported data may be compromised. This highlights the need for continuous investment and training in water quality monitoring infrastructure.
How Water Quality Monitoring Stations Collect Data
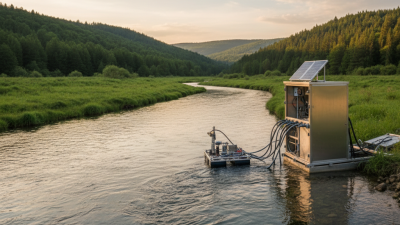
Water quality monitoring stations play a vital role in ensuring healthy aquatic environments. These stations collect data on various parameters, enabling stakeholders to assess pollutant levels and track changes over time. They are often strategically placed in lakes, rivers, and coastal areas to monitor water health effectively.
These stations utilize advanced sensors to measure factors such as pH, turbidity, dissolved oxygen, and levels of specific contaminants. For instance, a 2022 report by the Environmental Protection Agency highlighted that sensors can detect nitrogen levels down to 0.1 mg/L, providing critical insights into nutrient pollution. The data collected can indicate seasonal trends and potential pollution sources.
Additionally, water quality monitoring stations can transmit real-time data to centralized databases. This immediate access allows for timely responses to pollution events. However, the reliability of this data can be influenced by sensor calibration and environmental interferences. A study presented in the Journal of Environmental Management emphasized the importance of regular maintenance and validation processes to ensure accurate readings. Continuous improvement in these monitoring techniques is essential for effective water quality management.
Methods of Analyzing Water Quality Data
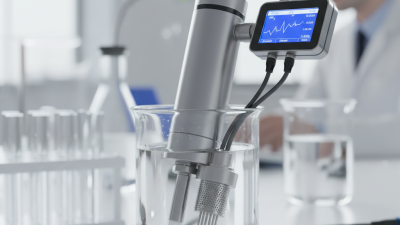
Water quality monitoring stations are essential for tracking the health of aquatic environments. They collect data on various parameters, including pH, turbidity, and dissolved oxygen levels. This data is critical for understanding ecosystem health and managing resources.
Analytical methods for evaluating water quality include chemical assays and biological assessments. Chemical assays quantitatively measure contaminant levels, such as heavy metals and nutrients. According to the U.S. Environmental Protection Agency, over 80% of U.S. surface waters are monitored through such methods. Biological assessments involve examining organisms in water, providing insights into the ecological balance. These combined approaches offer a comprehensive view of water quality.
Tips: Keep your monitoring station well-calibrated. Regular maintenance ensures accurate data collection. Consider seasonal variations in data; they can significantly affect outcomes. Embrace new technology, as advances are frequent in the field. The dynamic nature of water ecosystems means ongoing challenges in effectively analyzing and interpreting data. Observing trends over time is crucial for making informed decisions in water management.
Water Quality Monitoring Data
This chart displays the monthly average levels of key water quality parameters monitored over a six-month period.
Applications and Importance of Water Quality Monitoring Stations
Water Quality Monitoring Stations play a vital role in safeguarding our water sources. These stations analyze various parameters, including pH, turbidity, and dissolved oxygen levels. The data collected provides insights into the health of aquatic ecosystems. Monitoring stations often sample water from rivers, lakes, and reservoirs. This helps in detecting pollutants and tracking changes over time.
The importance of these stations extends to public health. Contaminated water can lead to serious health issues. Regular monitoring helps in managing water quality and ensuring safety. Additionally, these stations aid in environmental conservation efforts. They support research on water-related issues and guide policymakers. The effectiveness of monitoring stations depends on proper maintenance and calibration.
However, challenges exist. Some stations may lack the technology to provide real-time data. Others might be underfunded, affecting their operations. It's crucial to address these gaps for better water quality management. Ongoing training for operators can also improve reliability. This ensures that data is accurate and reliable for decision-making. Continuous improvement in methods and technology will enhance monitoring efforts.
Water Quality Monitoring Station Data
| Parameter |
Units |
Sample Value |
Status |
| pH |
- |
7.2 |
Normal |
| Dissolved Oxygen |
mg/L |
8.5 |
Normal |
| Turbidity |
NTU |
3.0 |
Normal |
| Nitrates |
mg/L |
0.5 |
Normal |
| Phosphates |
mg/L |
0.1 |
Normal |


 Contact WhatsApp
 Contact Phone
 Contact Email